3 Key Phases Of Any Good Data Visualization Project
Forbes Leadership
DECEMBER 29, 2022
While data is a powerful catalyst for change, preparing and presenting it can be a complex process.
This site uses cookies to improve your experience. By viewing our content, you are accepting the use of cookies. To help us insure we adhere to various privacy regulations, please select your country/region of residence. If you do not select a country we will assume you are from the United States. View our privacy policy and terms of use.
Forbes Leadership
DECEMBER 29, 2022
While data is a powerful catalyst for change, preparing and presenting it can be a complex process.
AIHR
OCTOBER 11, 2023
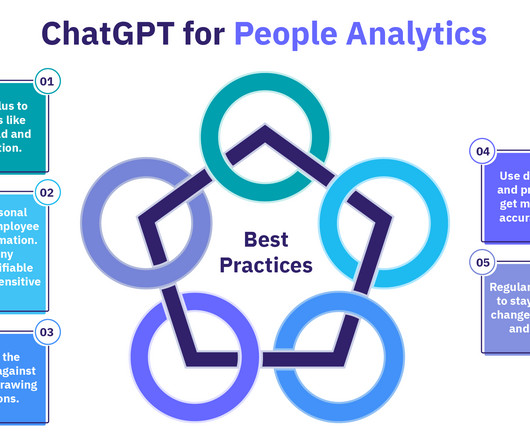
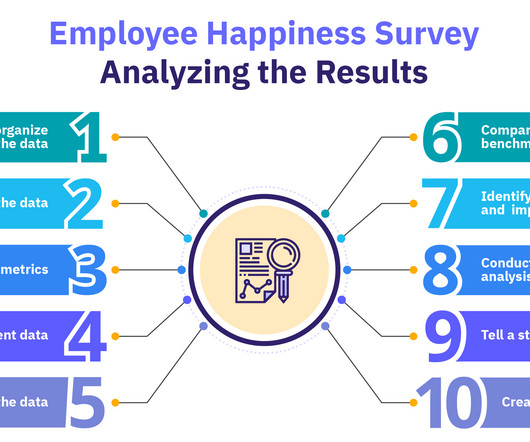
HR professionals who harness ChatGPT for people analytics gain a powerful tool for extracting meaningful insight from the vast amounts of data being collected. With its ability to comprehend language and generate text, ChatGPT can participate in a conversation that simplifies your efforts to leverage data effectively.
This site is protected by reCAPTCHA and the Google Privacy Policy and Terms of Service apply.
Harvard Business Review
NOVEMBER 10, 2023
Now, spatial computing is already starting to make an impact, including on communication and co-presence, manufacturing, gaming, human resources, media, sports and entertainment, and data visualization.
AIHR
FEBRUARY 23, 2024
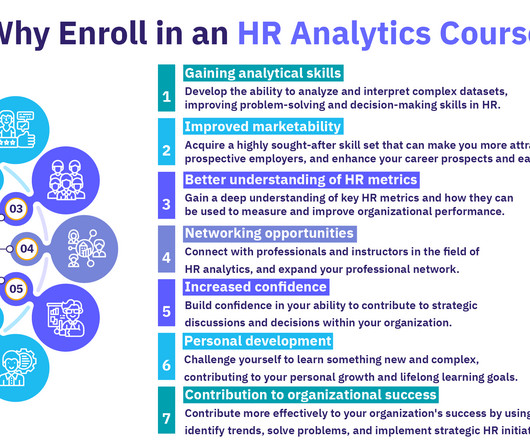
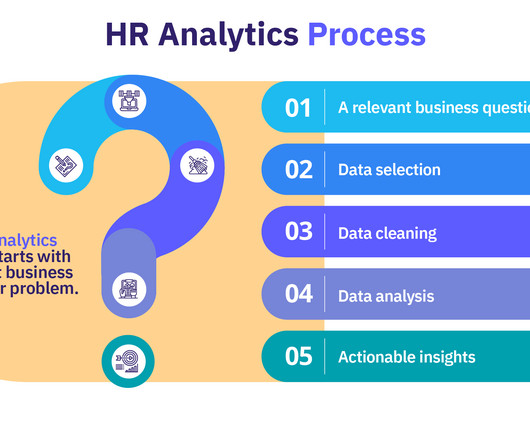
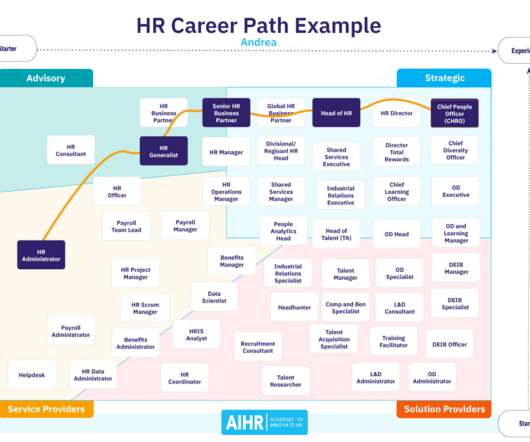
With a good command of HR analytics and a data-driven mindset, you’re better prepared to navigate today’s business challenges and ready to unlock insights for strategic decision-making, optimizing workforce planning, and enhancing employee engagement and productivity.
Viima
DECEMBER 8, 2022
As visual creatures, we rely on graphic representations to simplify and communicate complex data. Over the past decades, processing information has become more challenging than ever, yet decision-making relies heavily on understanding and communicating this data.
Chief Executive
SEPTEMBER 8, 2022
Today’s C-Suite leaders have high expectations of data. They want to be able to whip out their smartphones and bring up beautiful visualizations of trends that give them actionable insights into the business at a granular level. What’s usually missing is the part in the middle that connects the raw data with those fancy presentations.
AIHR
NOVEMBER 28, 2022
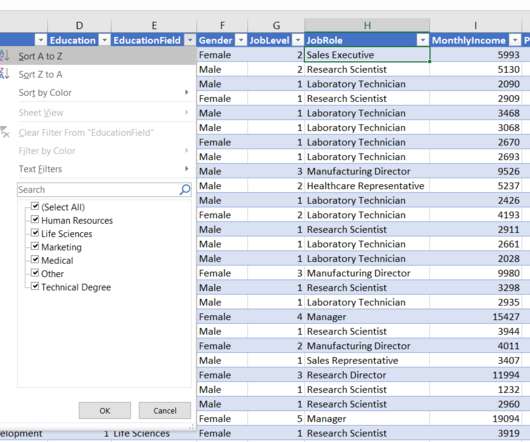
Microsoft Excel is the market leader when it comes to data analysis, both in HR and other business functions. While it is no substitute for an HR Information System and does not offer the most advanced people analytics capabilities, it is the all-time favorite for quick analysis and data visualization. HR data analysis process.
AlignOrg
AUGUST 1, 2023
When we use data analytics to understand how this ecosystem works – to make the invisible, visible – we can then make the design choices that help the organization reach its full potential. Today, we’ll explore four critical insights that can be revealed using data analytics.
UVA Darden
JANUARY 30, 2024
Subscribe About the Expert Anthony Palomba Assistant Professor of Business Administration Anthony Palomba teaches leadership communication and data visualization in the MBA program as well as management communication in the MSBA program.
UVA Darden
DECEMBER 1, 2023
Subscribe About the Expert Anthony Palomba Assistant Professor of Business Administration Anthony Palomba teaches leadership communication and data visualization in the MBA program as well as management communication in the MSBA program.
UVA Darden
DECEMBER 13, 2023
Darden Professors Mike Lenox and Yael Grushka-Cockayne speak with Professor Anthony Palomba, who teaches leadership communication and storytelling with data at Darden. His teaching interests are focused on how business professionals can present data results and actionable insights to key stakeholders through storytelling.
AIHR
FEBRUARY 28, 2024
Importance of HR analytics HR analytics examples Key HR metrics Data analytics in HR: How to get started How to transition from descriptive to predictive and prescriptive analytics in HR HR analytics certification FAQ What is HR analytics? In other words, HR analytics is a data-driven approach to Human Resources Management.
Peter Winick
JULY 21, 2022
The trick is to turn abstract thought into concrete ideas, and to visualize those ideas in a way that captures your audience’s attention. Three Key Takeaways: Don’t blindly follow data. Karen Hold You said, we were doing the same thing you were doing because we’re using Nielsen syndicated data.
Nir Eyal
AUGUST 1, 2021
When I recently came across the headline “The World’s Most Influential Values, In One Graphic,” I couldn’t help but click–a good data visualization is like catnip for me. When you replace the typical definition of ‘values’ with a better one, your life suddenly becomes clearer.
AIHR
MARCH 11, 2024
Research by FTSE Russell analyzed 25 years of market data of the annual returns of publicly traded companies featured on the ‘100 Best’ lists versus the rest. Decide how you will collect answers: An online survey software tool will help you collect data anonymously and effectively analyze its results.
AIHR
JULY 14, 2023
A skills matrix is the key to tracking this data. A completed skills and competency matrix visualizes the skills that are required, the skills that are available, and the skills that are missing. The visual nature of the skills matrix helps you see the strengths and opportunities for improvement quickly and clearly.
Walk Me
FEBRUARY 7, 2024
This practice involves the creation of a visual representation of the processes within your company, detailing each step involved in executing a business function. Security and compliance : Ensuring data security and compliance with industry regulations is crucial, especially when mapping processes that involve sensitive information.
AIHR
JULY 5, 2022
People analytics is the practice of using people, talent, and organizational data to gain insights and make more informed decisions about your people strategy that will advance your business. Collecting and assessing this type of data has previously been referred to as HR analytics, talent analytics, or workforce analytics.
High Scalability
JULY 11, 2022
Other images considered: one byte of RAM in 1946 ; visual guide on troubleshooting Kubernetes ; Cloudflare using lava lamps to generate cryptographic keys ; 5MB of data looked like in 1966. Every cell a universe. Most detailed image of a human cell to date. microscopicture. My Stuff: Love this Stuff?
15Five
APRIL 21, 2022
Read on to hear about how 15Five recently rolled out a new process to visualize compensation data and communicate total rewards value to our team. Communicating and visualizing compensation. Using compensation data to establish fair and equitable pay practices is essential in today’s competitive talent market.
AIHR
DECEMBER 18, 2023
Possibility of inaccuracies : Risk of inaccuracies in data, especially if not updated regularly or managed properly. Skills matrix vs. training matrix The skills matrix focuses on assessing and visualizing current employee skills, whereas the training matrix tracks and manages employee training activities and progress.
Association Now Workplace
AUGUST 24, 2023
The responses covered everything from data to revenue to engagement, but what they all have in common is adding people to the team that would benefit members or organizational effectiveness. Leona Scott President, JEP Marketing Communications Visual graphics content creator. Read on for what your colleagues had to say.
Vantage Circle
JANUARY 31, 2024
They serve as tangible, visual recognition of excellence, motivating individuals and enhancing workplace morale, productivity, and retention. Data Security: Storing and managing digital badges requires robust data security measures to protect sensitive information. What are employee recognition badges?
AIHR
MAY 24, 2023
Organizational models are applied to sort and draw conclusions from the data and determine a course of action. Step 2: Determine the purpose of the analysis Understand your reasons and set goals for performing the analysis so you know what data will need to be collected. Who or what you’ll collect data from.
AIHR
OCTOBER 19, 2023
The template lets you easily insert essential information and compelling data visualizations to share HR’s activities, achievements, and added value. The HR board report template With this ready-to-use HR board report template, you can save time and effort, reduce the risk of oversight, and strengthen your credibility.
AIHR
OCTOBER 12, 2022
Headcount analysis enables HR to closely monitor this data and look for key patterns and trends in the data. This will visually display the organizational structure so that everyone can see the relationships, processes, and responsibilities and understand them. Why is headcount analysis important?
AIHR
JUNE 14, 2022
Data-driven recruitment brings a lot of benefits to organizations. What exactly does data-driven recruitment entail, why is it important, and what are the best practices? Contents What is data-driven recruitment? Data-driven recruitment examples Why is data-driven recruiting important? Let’s dive in.
AIHR
AUGUST 3, 2021
Decision-making about people in an organization is now more than ever analytical and data-based, just like any other management discipline. People analytics is the practice of collecting and applying organizational, people, and talent data to improve critical business outcomes. What is people analytics? Benefits of people analytics.
AIHR
OCTOBER 25, 2022
They provide the data necessary to improve your recruitment process, which directly affects your business’s bottom line. Make your annual HR report impactful by using data and visualization in combination with stories and perspectives. Tell a story with data. Use visuals when reporting on your data.
SME Strategy
MARCH 6, 2023
However, without a data strategy , the likelihood of achieving successful outcomes is greatly diminished. In today's data-driven world, data is becoming increasingly important for organizations to gain a competitive advantage and make informed decisions. However, simply having a data strategy is not enough.
Zenefits
JANUARY 25, 2023
These channels should have visualizations and content that attract the right candidates. Visualizations, like pictures or videos, should have inclusive content that relates to a variety of people. Visualizations, like pictures or videos, should have inclusive content that relates to a variety of people.
AIHR
OCTOBER 26, 2023
The post The 9 Box Grid For Talent Management appeared first on AIHR.
AIHR
AUGUST 9, 2022
That’s why employee turnover data analysis is a valuable tool in your HR arsenal. Let’s dive into all you need to know about employee turnover data analysis! Contents What is employee turnover data analysis? Why conduct employee turnover data analysis How to conduct employee turnover data analysis.
AIHR
DECEMBER 13, 2022
Exit interview data analysis is the key to making the most of your exit interview process. The data behind why employees leave can help you better grasp what’s affecting your organization’s turnover and what you can do about it. The exit interview data analysis process. The exit interview data analysis process.
AIHR
SEPTEMBER 13, 2023
Recruitment Analytics: Measure the effectiveness of sourcing strategies , removing hiring bottlenecks, and making data-driven decisions to improve overall recruitment results. Data analysis: Strong analytical skills to comprehend compensation data and make informed decisions about compensation structures and adjustments.
AIHR
FEBRUARY 28, 2023
Rather, it aims to drive specific actions to take based on data-driven insights. It is important to utilize various data points as input to determine criticality. Step 3: Collect talent data for identified individuals Your next step is to collect talent data for the identified target employees.
AIHR
JANUARY 24, 2023
DEI data builds the foundation of an effective DEI strategy. Gathering and evaluating DEI data is the best way to make decisions and measure and convey progress. Contents What is DEI data? Why collect DEI data? Contents What is DEI data? Why collect DEI data? How to collect DEI data What is DEI data?
AIHR
DECEMBER 13, 2023
Cons Requires access to employee data May not be accurate if the data is not up-to-date Requires careful interpretation of the results. low, moderate, high) Create a visual representation of the grid to facilitate discussions and decision-making. Include both objective data (e.g., Include both objective data (e.g.,
Help Scout Leadership
MAY 14, 2021
Reports : Visualize and benchmark customer support performance and identify areas for improvement. has used Help Scout to easily visualize their customer success metrics and set data-backed expectations with reports. For Perog, the tags feature has proven instrumental in cataloging bugs and visualizing any system-wide issues.
AIHR
MAY 15, 2023
A successful HR Specialist should be detail-oriented, data-driven, and ethical. HR Analyst Job description An HR Analyst collects, analyzes, and reports HR data to provide recommendations to senior management on people-related issues. To succeed, they need to have data analysis skills and proficiency with MS Excel.
Walk Me
SEPTEMBER 6, 2021
Data can be manipulated easily in Excel. Excel is built for data. This makes it easy to create charts or perform calculations on that data, without the need for external software. Data can also be exported easily to other software. An Excel, which makes it easy to get a visual picture of employee productivity.
15Five
JANUARY 9, 2024
While it’s historically been an administrative function, organizations are now asking their HR people to be data analysts, marketers, behavioral science experts, productivity experts, etc. It’s even getting better at some visual components. Other leaders will need to see the ROI and want to have more data-driven conversations.
AIHR
APRIL 1, 2024
Job evaluation is the systematic process of using internal and external data to determine the relative value that specific jobs bring to an organization. Job evaluation methods There are a variety of methods for job evaluation, and all of them involve comparisons derived from either qualitative or quantitative data.
Michael McKinney
APRIL 15, 2024
I learned, for example, to turn my internal chatter to my advantage by reframing negative thoughts as useful data rather than objective reality. Visualize and be specific about what and when. By learning to recognize these thought patterns and course-correcting accordingly, I’ve spared myself a lot of trouble.
Expert insights. Personalized for you.
We have resent the email to
Are you sure you want to cancel your subscriptions?
Let's personalize your content